Latency Testing Through AWS Cloud WAN Network
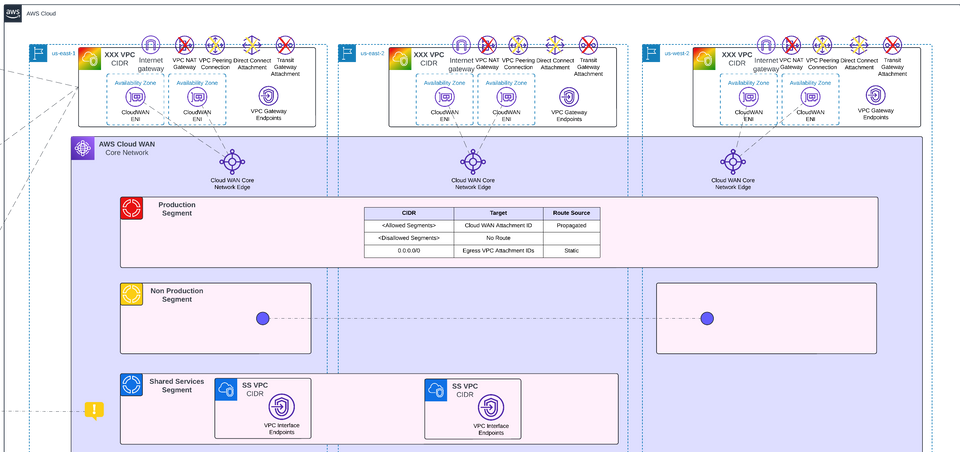
Table of Contents
- Introduction
- Testing Methodology and Setup
- Test Results and Data Analysis
- Key Observations and Takeaways
Originally written for GuidePoint Security and shared here with permission.
Introduction
AWS Cloud WAN is a service that can help organizations manage and visualize their global networking infrastructure. It enables complex network connectivity between both AWS and non-AWS environments without the challenge of managing dozens or hundreds of connections through services like VPC peering or Transit Gateway. With all of that being said, the abstraction of the management of these resources may cause concern for latency-sensitive applications. In order for organizations to make more informed decisions on whether Cloud WAN may be an effective solution for network management we conducted a battery of tests to determine what configurations will function for varying requirements.
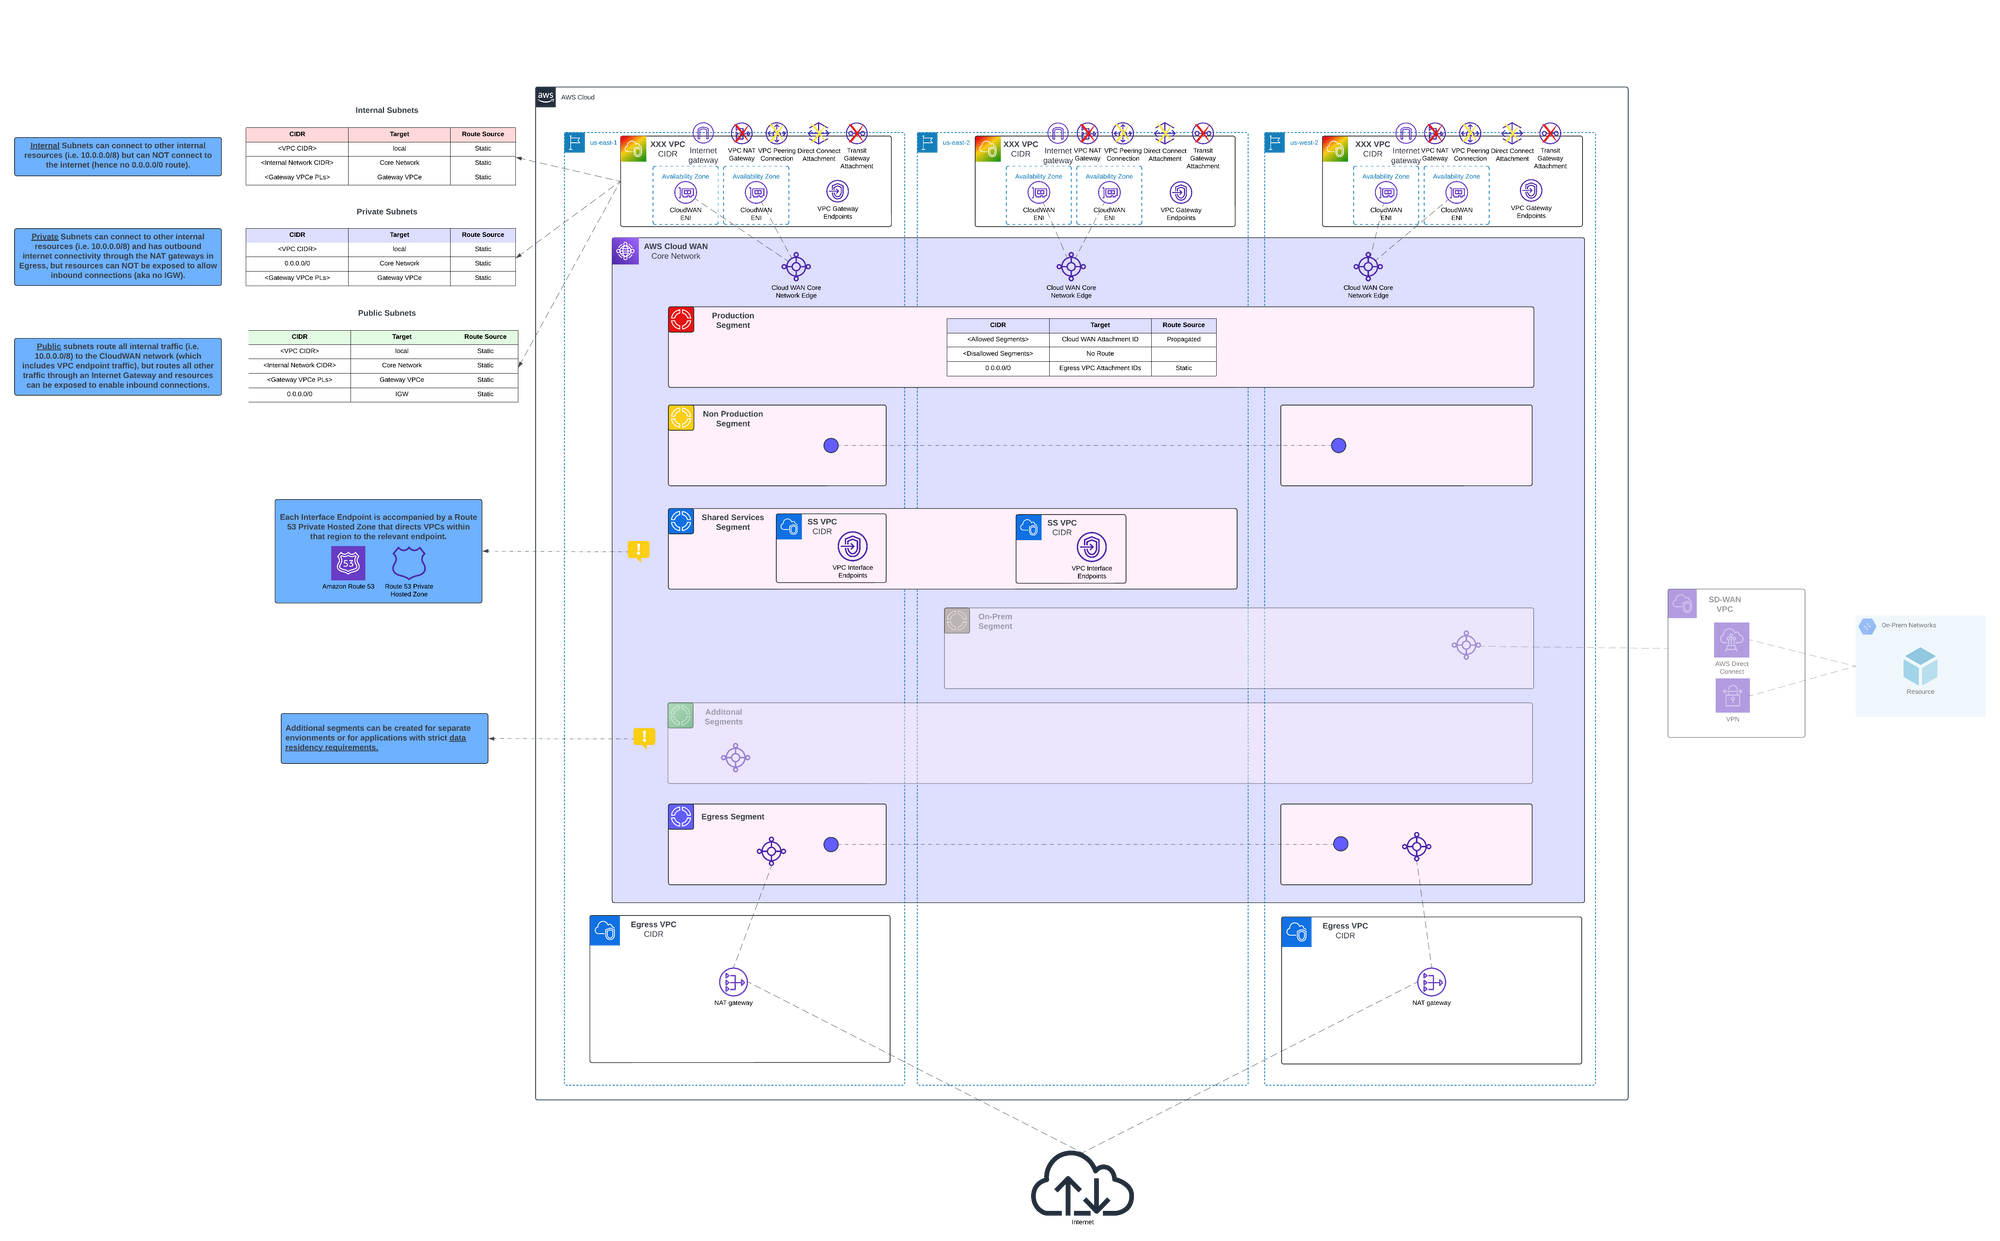
For the purposes of conducting these tests, infrastructure was built and deployed as depicted in the architectural diagram below. For more information on how this architecture was designed and functions check out this article.
Important Note: These tests are not intended as a direct “Cloud WAN vs. non-Cloud WAN” head-to-head comparison of the exact same route or resource. Rather, each test examines a specific pathway—some using Cloud WAN and some not—to see if the results meet (or do not meet) the latency tolerance or throughput requirements of a hypothetical application.
Testing Methodology and Setup
Four key tests were conducted spanning both latency and throughput to both internal and external resources and from a variety of regions, through a variety of networking pathways. Below is a table with key information about each test. For consistency the upload/download operations were all conducted using a t2.micro EC2 instance with a 20gb drive attached. All upload, download, and list tests were conducted three (3) times and results show the average of all tests conducted. The ICMP tests were run for fifteen (15) consecutive pings and again captured as an average along with minimum, maximum, and jitter to show the range of the results. All tests were conducted in the us-east-1, us-east-2, and us-west-2 regions so results may vary slightly when employing other regions.
|
ID |
Test |
Scenario |
Metric |
|
1 |
S3
Upload/Download |
Upload 1Gb,
and 5Gb via four pathways |
Total time to
upload/download, calculation of bandwidth |
|
2 |
S3 List and
Download Small Objects |
List and
Download 100,000 1Kb objects via four pathways |
Total time to
complete pagination, observation on response (errors, delays) |
|
3 |
Ping Latency
Tests Between EC2 Instances |
Conduct ping
tests between instances in same and different AZs, Regions, and VPCs |
Ping latency,
packet loss (if any), jitter (variability in response times) |
|
4 |
Ping Latency
to External Services |
Measure
network latency for outbound connections to standard external resource
(8.8.8.8/Google) |
Average
response time for each path, packet loss, jitter |
Test Results and Data Analysis
Test 1 – S3 Upload/Download
The purpose of the upload and download test was to test throughput for a small number of large files. The first pathway tested was a Gateway VPC Endpoint deployed into the same subnet as the EC2 instance. Specifically for services that support Gateway endpoints this is a viable option even in large network because Gateway endpoints are free and having them deployed into each VPC does not affect budgets.
The second pathway tested is perhaps more relevant for services that do not support Gateway endpoints or even custom shared services organization may be hosting. In this case the traffic is initiated on the EC2 instance but traverses through the AWS Cloud WAN network, presumably hitting a managed Transit Gateway and then forwarded in line with the rules of the network to the Shared Services VPC within the same region and ultimately to the Interface VPC endpoint.
The third test utilized the publicly available S3 endpoints through an EC2 instance deployed in a public subnet (default route to an IGW). The results we see here would likely be very similar for instance using a NAT gateway within the same region along with the public endpoints.
The final test was an extreme example where we are forcing the traffic cross-region to an Egress VPC. In this case the traffic started in the us-east-2 Production Segment and was forwarded to the us-east-1 Egress Segment. Generally speaking, for organizations using NAT gateways in their Egress setup, there should be an Egress VPC/Segment with one or more NAT gateways in all regions in use. However, for organizations deploying more substantial (and more costly) inspection architecture it may only be worth deploying those appliances in a set number of regions and sending traffic in regions without those devices through the nearest one. Because of this use case, it is important to know what type of latency may be added with this cross-region egress of traffic.
|
Network Path |
File Size |
Operation |
Average Time
(s) |
Average
Throughput (MiB/s) |
|
Gateway VPC
Endpoint (same VPC) |
1GB |
Download |
16.52 |
61.97 |
|
Upload |
18.93 |
54.11 |
||
|
5GB |
Download |
84.31 |
60.75 |
|
|
Upload |
86.50 |
59.32 |
||
|
Interface VPC
Endpoint (Shared Services VPC) |
1GB |
Download |
17.24 |
59.33 |
|
Upload |
18.37 |
55.66 |
||
|
5GB |
Download |
88.87 |
57.75 |
|
|
Upload |
86.52 |
59.31 |
||
|
Public S3
Endpoint via IGW (public subnet) |
1GB |
Download |
22.06 |
46.35 |
|
Upload |
18.56 |
55.11 |
||
|
5GB |
Download |
96.16 |
53.30 |
|
|
Upload |
86.11 |
59.61 |
||
|
Public S3
Endpoint via NAT Gateway in another region (Egress VPC) |
1GB |
Download |
59.78 |
17.10 |
|
Upload |
28.21 |
36.24 |
||
|
5GB |
Download |
278.46 |
18.40 |
|
|
Upload |
128.96 |
39.74 |
Some of the key takeaways of these results are that between Gateway VPC endpoints and Interface VPC endpoints the results are fairly similar, despite the fact that the latter has to traverse the Cloud WAN network to access the endpoint. Public S3 endpoints are almostas good, presumably the slight reduction in throughput is due to a need to traverse the public internet where the endpoint paths remain within the AWS internal network. Finally, the cross-region egress adds significant latency, although not by any means intolerable for applications that are not particularly latency sensitive. Especially for the large file transfer (5Gb) that achieved a throughput is ~36-39 MiB/s in comparison to the ~54-59 MiB/s for the first three tests. This test was conducted between us-east-2 (traffic source) and us-east-1 (egress), so the throughput would also likely be affected by how geographically close the source and egress regions are.
Test 2 – S3 List and Download 100,000 Small Objects
The S3 list and download tests were conducted to test how quickly each pathway could paginate and retrieve many very small objects (such as logs for example). For this test, 100,000 1Kb objects were generated and placed within the S3 bucket used for testing. The exact same four pathways were used as in the first test.
|
Network Path |
Operation |
Average Time
(s) |
Average
Throughput MiB/s |
|
Gateway VPC
Endpoint (same VPC) |
List |
43.94 |
|
|
Download |
555.89 |
3.05 |
|
|
Interface VPC
Endpoint (Shared Services VPC) |
List |
44.61 |
|
|
Download |
576.30 |
2.94 |
|
|
IGW in Public
Subnet |
List |
44.78 |
|
|
Download |
591.65 |
2.86 |
|
|
NAT Gateway
through Egress in another region |
List |
38.15 |
|
|
Download |
1564.06 |
0.11 |
In this case, the time it took to list the objects through all four pathways was approximately the same. Why was the cross-region listing marginally faster? Your guess is as good as mine. Perhaps the slightly more pertinent result here is that we see a similar pattern in the speeds of the four pathways for downloading as the first test, with a slight exaggeration of the results due to the nature of this particular test. This indicates that Gateway endpoints within the same VPC have the absolute lowest latency in response time for new requests, closely followed by Interface VPC endpoints through the Cloud WAN network, and the IGW in public subnets. Unsurprisingly, the cross-region download was the slowest, but unlike the first test the jump here is pretty significant, indicating that the delay from sending a large number of small requests is more affected by the cross-region solution compared to the small number of large requests.
Test 3 – Ping Latency Tests Between EC2 Instances
The purpose of the third test was to evaluate system-to-system communication between EC2 instances using various pathways. Something to consider here is that all instances are using the standard networking interfaces available on EC2 instances, so even the best of the latency testing we see here could be improved by employing some of the services and features available in AWS expressly designed for things like High-Performance Computing (HPC) clusters.
The first pathway tested was a best-case-scenario for average components which was two EC2 instances deployed not only in the same VPC but also the same AZ. This traffic obviously does not traverse the Cloud WAN network but helps establish a baseline for further tests.
The second pathway is similarly the same VPC and region but different AZ’s. The third and fourth tests are different VPCs, same region, and testing both same and different AZ’s. This is the first set of pathways that traverses the Cloud WAN network but does not leave the region. Finally, the last two tests are cross-region tests from us-east-1 to us-east-2, then us-east-1 to us-west-2.
|
Network Path |
Average
Latency (ms) |
Min Latency
(ms) |
Max Latency
(ms) |
Packet Loss
(%) |
Jitter (ms) |
|
Same VPC,
same AZ (east-1a to east-1a) |
1.02 |
0.52 |
3.06 |
0% |
0.58 |
|
Same VPC,
cross-AZ (east-1a to east-1b) |
1.50 |
0.92 |
2.71 |
0% |
0.43 |
|
Cross VPC,
same AZ (prod east-1a to ss east-1a) |
1.04 |
0.55 |
3.80 |
0% |
0.78 |
|
Cross VPC,
cross AZ (prod east-1b to ss east-1a) |
1.44 |
1.03 |
2.42 |
0% |
0.41 |
|
Cross region
us-east-1 to us-east-2 |
15.65 |
15.02 |
16.66 |
0% |
0.37 |
|
Cross region
us-east-1 to us-west-2 |
65.54 |
65.00 |
66.30 |
0% |
0.39 |
The results of these tests indicate that when systems are within the same AZ, regardless of whether they are in the same VPC or not, they have similar latency (1.02 and 1.04 ms respectively). Similarly, for instances within the same region but across AZs there is nearly the same latency whether they are in the same VPC or traversing the Cloud WAN network into another VPC (1.50 and 1.44 ms). Most likely this means that underneath the hood AWS is employing the same managed infrastructure to support the connectivity between systems both within and without a VPC. The connectivity created through Cloud WAN is an easier way to create a logical design to the connectivity but is supported by the same underlying components. Finally, the cross-region testing shows an increased latency - 15.65 ms for east to east, and 65.54 ms for east to west, which is expected. These findings show that ideally organizations should have at least one set of shared services and egress components deployed per set of regions, i.e. (us-east-#). The worst-case scenario involves not only traversing to another region to access systems but also reaching a region separated by a substantial real-world geographical distance. Fortunately, despite varying amounts of latency, all connectivity options have extremely low rates of packet loss* and relatively low jitter (aka variability in test results).
* The results of this test showed no packet loss, but that does not mean that there is a guarantee of 0% packet loss on these network pathways, only that the odds are very low of any loss.
Test 4 – Ping Latency to External Services
The purpose of this final test was to evaluate latency to publicly available services outside of AWS. For this test, one of the Google DNS servers (8.8.8.8) was used as a consistent external source in order to better isolate the internal AWS components in the results. Three pathways were considered, the first was a NAT gateway within the same region, and the second was a NAT gateway in another region (us-east-2 to us-east-1). Both tests utilized the Cloud WAN Egress segment. The final test used an IGW deployed within the same VPC.
|
Network Path |
Average
Latency (ms) |
Min Latency
(ms) |
Max Latency
(ms) |
Packet Loss
(%) |
Jitter (ms) |
|
NAT Gateway
(same region) |
2.33 |
1.98 |
2.77 |
0% |
0.23 |
|
NAT Gateway
(cross region) |
70.64 |
70.14 |
71.95 |
0% |
0.40 |
|
IGW
(us-east-1) |
1.38 |
1.13 |
1.76 |
0% |
0.21 |
Once again, these tests show that regardless of exactly how traffic is egressing, as long as the egress is within the same region the latency is pretty minimal. The only scenario that adds significant latency is a cross-region egress. This metric would likely also increase proportionally with the geographical distance between the regions.
Key Observations and Takeaways
Overall, the results indicate that AWS Cloud WAN introduces negligible overhead for intra-region traffic, whether connecting through Gateway or Interface VPC endpoints. Although Interface endpoints rely on Cloud WAN routing in the background, they still deliver nearly the same latency and throughput as the traditional Gateway endpoints when operating in the same region. Likewise, even cross-VPC connections within one region exhibit latency comparable to staying entirely within a single VPC, suggesting that AWS manages traffic through the same underlying high-performance backbone.
When it comes to cross-region traffic, there is a predictable increase in latency that becomes more pronounced for large transfers or repeated small object requests, such as log files. Cloud WAN is generally an excellent choice for establishing global connectivity. However, for workloads demanding very low latency, the ideal approach is to deploy NAT gateways, shared services, and inspection appliances in every region you operate in, within the Cloud WAN configuration. At a minimum, group your regions by geographical proximity (for example, at least one of the us-east-* regions) and ensure these services exist in each group. Forcing traffic across regions that fall outside of these groupings constitutes the worst-case scenario in terms of added latency. On the other hand, if your environment can tolerate slight increases in latency, Cloud WAN’s centralized management helps simplify network operations without compromising overall reliability or performance.
Here are the most important takeaways to consider:
- Minimal Overhead Within the Same Region: Whether traffic is directed through Gateway or Interface VPC endpoints, the performance difference is typically negligible when staying in-region.
- Cross-Region Latency: As expected, latencies jump when data must traverse geographical distances, indicating the need for regional egress endpoints and shared services if your applications are latency-sensitive.
- Small vs. Large Transfers: Large files transfer quickly within the same region, but multiple small requests (e.g., logs) see more latency impact when crossing regions.
- Public vs. Private Endpoints: Public S3 endpoints and external services (e.g., 8.8.8.8) show minimal overhead so long as the traffic exits in the same region. Shifting egress to another region increases response times significantly.
- Architectural Considerations: To balance performance and costs, you may deploy specialized egress or inspection appliances in only a few strategic regions while remaining aware of the added latency for workloads in other regions.
In conclusion, AWS Cloud WAN proves to be a strong option for organizations seeking to simplify global network management without facing prohibitive latency. While it is crucial to deploy key resources in the same regions as your workloads when low latency is paramount, Cloud WAN offers a flexible and high-performing solution for most enterprise connectivity needs.